A bottom-up planning model for CT/PT counts from 10 MW to 500 MW. Change the campus size, redundancy and voltage level, and the counts update — with every assumption written down, and a CSV you can put in a bid package.
Planning modelInteractive estimatorCSV includedCite this page
100 MW base case
255
IEC HV + MV instrument transformers, before spares
With spares
255–306
0–20% for spare bays and future feeders
LV current sensors
1,333–2,666
Rack + PDU monitoring, a separate product category
Estimate your own campus
Same model as the table below. Change one field and every count updates; download the scenario when you are done.
Scenario100 MW·2N·10 kV·110 kV·60 kW
Total IEC
255
With spares: 255–306
MV CT
192
MV PT
33
HV CT
24
HV PT
6
LV sensors
2,666
MV bays64
MV bus sections11
HV circuits8
HV bus sections2
Racks1,333
IT 80 MW · 2 paths
Planning numbers, not a bill of materials. Bay count and bus segmentation still depend on the single-line diagram, the owner's specification and the protection study.
Benchmark ranges
Campus
MV bays
MV sections
HV circuits
HV CT
HV PT
MV CT
MV PT
Total IEC
LV sensors
10 MW
8
2
2
6
6
24
6
42
266
20 MW
14
3
2
6
6
42
9
63
534
30 MW
20
4
2
6
6
60
12
84
800
50 MW
32
6
4
12
6
96
18
132
1,334
100 MW
64
11
8
24
6
192
33
255
2,666
150 MW
96
16
10
30
9
288
48
375
4,000
200 MW
128
22
14
42
12
384
66
504
5,334
300 MW
192
32
20
60
15
576
96
747
8,000
500 MW
320
54
34
102
27
960
162
1,251
13,334
Rows are generated by the same model as the estimator: 2N, 10 kV MV, 110 kV HV, 60 kW racks, PUE 1.25. Total is before spares; the 0–20% spare band is a separate column in the CSV. Changing the estimator above does not rewrite this table — it always shows the default scenario.
Model constants
Every number below is an input to the model, not a survey result. If your project uses different transformer sizes or bay counts, change the constants and the whole table moves.
PUE
IT load = campus load / PUE
1.25
MV transformer size
2.5 MVA at 10 kV, 5 MVA at 35 kV
2.5 / 5 MVA
Bays per MV bus section
A section is added every this many bays
6
HV feed capacity
30 MVA at 110 kV, 60 MVA at 220 kV
30 / 60 MVA
HV circuits per bus section
Drives the number of HV PTs
4
Spare allowance
Upper bound for spare bays and future feeders
20%
How the counts are derived
MV bays
bays = ⌈IT_load ÷ S_MV⌉ × paths
One bay per MV transformer, duplicated for 2N
Bus sections
sections = max(2, ⌈bays ÷ 6⌉)
Bays ÷ bays per section, rounded up, minimum 2
CT count
CT = 3 × (bays + circuits_HV)
Three phase CTs per bay or circuit
PT count
PT = 3 × (sections_MV + sections_HV)
Three single-phase units per bus section
Total
total = CT_HV + PT_HV + CT_MV + PT_MV
HV CT + HV PT + MV CT + MV PT, before spares
Method
1. Count bays
Start from the single-line diagram: incoming, bus tie, transformer, UPS and cooling feeders, duplicated for 2N.
2. Count bus sections
Each MV bus section gets three single-phase PTs; each bay gets three phase CTs, plus neutral CTs where required.
3. Add spares
Add 0–20% for spare bays, future feeders and design changes; keep LV sensors in a separate line.
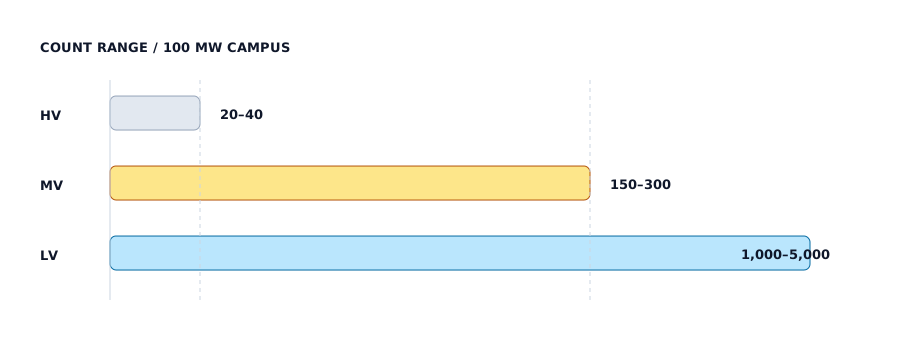
Count ranges by voltage level. The MV row dominates; the LV row is a different product category.
Assumptions
Campus load is measured at the utility meter; IT load follows from PUE 1.25.
2N means two full power paths; N+1 is modelled as one path with a spare allowance instead of duplication.
MV transformers are 2.5 MVA at 10 kV and 5 MVA at 35 kV; HV feeds are 30 MVA at 110 kV and 60 MVA at 220 kV.
Three phase CTs per bay or circuit; three single-phase PTs per bus section.
Counts are physical CT/PT units, not cores. A dual-core CT counts as one unit.
LV current sensors are excluded from the IEC instrument-transformer total.
Limitations
This is a planning model, not a statistical survey of installed data centers.
Bay count and bus segmentation vary by topology, redundancy and owner specification.
The model does not replace a project single-line diagram, protection study or bill of materials.
The tier table is generated from the model: it will move if you change the constants, and it is not a set of measured projects.
Download the benchmark CSV
One row per campus size, generated by the same model, with the assumptions written into the last column.
v2.0 · 2026-11-12Table and CSV are now generated by an explicit model; added the interactive estimator, model constants and derived counts from 10 MW to 500 MW.
v1.0 · 2026-11-06First published ranges at 30 / 100 / 300 MW with a 100 MW base case.
Cite this benchmark
You may cite the ranges with a link to this page. Suggested format:
PotentialTransformers.com (2026). AI Data Center Instrument Transformer Benchmark, v2.0. https://www.potentialtransformers.com/ai-data-center/benchmark
 中文Mainland China
 EnglishUnited States
 FrançaisFrance
 DeutschGermany
 LietuviųLithuania
 CymraegUnited Kingdom
 EestiEstonia
 MagyarHungary
 العربيةSaudi Arabia
 한국어South Korea
 SuomiFinland
 NorskNorway
 PolskiPoland
 EspañolLatinoamérica
 हिन्दीIndia
 SvenskaSweden
 MaltiMalta
 OʻzbekUzbekistan
 اردوPakistan
 NederlandsNetherlands
 БългарскиBulgaria
 LatviešuLatvia
 DanskDenmark
 RomânăRomania
 ไทยThailand
 ÍslenskaIceland
 Tiếng ViệtVietnam
 SlovenčinaSlovakia
 УкраїнськаUkraine
 עבריתIsrael
 日本語Japan
 ItalianoItaly
 PortuguêsPortugal
 РусскийRussia
 Kreyòl ayisyenHaiti
 ČeštinaCzechia
 GaeilgeIreland
 বাংলাBangladesh
 TürkçeTürkiye
 فارسیIran
 ΕλληνικάGreece
 BosanskiBosnia and Herzegovina
 MelayuMalaysia
 SlovenščinaSlovenia
 SrpskiSerbia
 Bahasa IndonesiaIndonesia
 HrvatskiCroatia